
Analyzing shifts in labor costs for financial planning starts by sorting the causes into two buckets. Wage growth and benefit inflation set the floor every employer plans around. Turnover, overtime, and staffing mix create the variance against that plan, especially in hourly-heavy operations.
Private-industry wages grew 3.1% in the 12 months ended June 2026, per the BLS Employment Cost Index, a figure any finance team can budget against. No benchmark tells a distribution center what it will cost to backfill two open roles at premium rates through peak season, which is why the workforce half of the line is the harder half to plan.
Finance and operations leaders who own the P&L at frontline employers in quick-service restaurants (QSR), retail, logistics, and hospitality carry this labor-cost line. The workforce drivers behind a shift, the segmentation that locates them, and the metrics that explain them sit outside the general ledger, and finance has to look there.
Fountain supplies that workforce data; the model, the budget, and payroll stay with finance.
What counts as a labor cost shift (and which ones can you manage)?
Labor cost is the fully-loaded cost of employing people. BLS tracks wages, benefits, and payroll taxes in its employer cost series, and recruiting and training sit on top as separate elements. A labor-cost shift is any sustained movement in that number, whether the price of an hour changed or the number of hours did.
At the 10th wage percentile, benefits add $3.18 an hour on top of $14.88 in wages, a 21% premium that base-rate models miss entirely.
Labor cost shifts fall into two categories. Market-driven shifts, merit budgets, benefit renewals, and minimum-wage changes, arrive on a schedule and apply to everyone. Hiring and scheduling decisions produce the workforce-driven shifts, which show up as turnover, overtime, open requisitions, staffing mix, and onboarding ramp, and a plan can move them.
For hourly-heavy operations, that second category is where forecast and actual part ways.
Variance analysis separates the two: a rate variance means the price of an hour changed, a volume variance means the number of hours did.
Why labor costs shift: the workforce drivers finance has to plan for
Six recurring drivers open the forecast-to-actual gap, and five of them respond to operational decisions.
- Turnover and replacement cost: Every exit reloads recruiting and onboarding spend and costs output while the seat ramps. The 2025 Fountain Frontline Report puts the average replacement cost near $7,000 per frontline exit. Quits in accommodation and food services hit 4.5% in June 2026, more than double the 2.0% all-industry rate in the BLS JOLTS data, so the reload rarely stops.
- Overtime from coverage gaps: Understaffed shifts get backfilled at premium rates, and sustained overtime raises the effective hourly rate across the affected crew, a rate shift that never appears in the wage budget.
- Time-to-hire drag: Every day a role sits open is a day of overtime or lost output, and at hourly volume those open days compound fast.
- Headcount and shift or location mix: Premium shifts and higher-cost sites move the total even when posted wages hold flat.
- Onboarding ramp: New hires draw full pay before full productivity, and even simpler roles take about eight weeks to get there. The Frontline Report also finds 43% of new hires leave within 90 days, so the acquisition cost often restarts before the first one pays back.
- Market forces: BLS puts benefit-cost growth at 3.8% and health benefits at 6.0% over the year ended June 2026. You forecast this category and absorb it.
Each of the first five is a hiring or scheduling decision before it becomes a budget line.
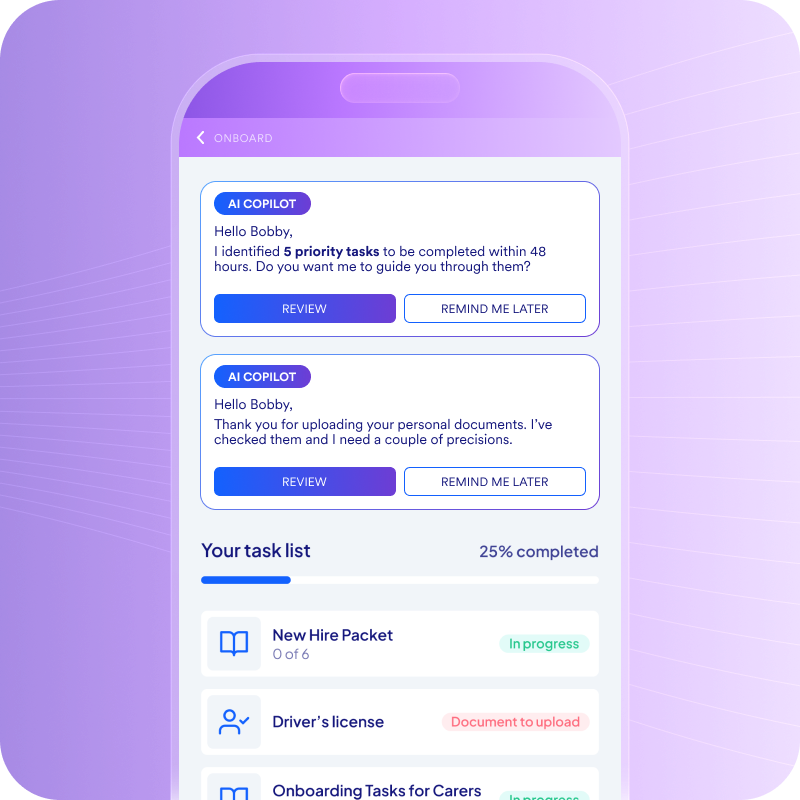
Faster ramp-up. Lower early attrition. AI onboarding built for speed, scale, and retention.
Top employers are already using Fountain’s Frontline OS to:
✅ Reduce turnover in the first 60 days
✅ Eliminate manual paperwork and task delays
✅ Accelerate new hire productivity with smarter workflows
Curious what smarter onboarding could unlock for your team?
Segmenting labor cost shifts to find what’s really moving
A company-wide average hides the few sites doing the damage. Read the shift along three cuts before trusting a blended number.
- By location: Labor cost per site measured against the network shows which locations carry the miss, the cut at the center of multi-store workforce planning.
- By role and shift: Nights, weekends, and premium-rate roles behave differently from the day shift, and roles diverge from each other inside the same location.
- By employment type: Calculate the loaded hourly cost separately for full-time, part-time, contract, and seasonal workers, because a mix shift toward contract or seasonal labor changes the fully-loaded rate even when posted wages hold.
One site running 15 uncovered eight-hour shifts a week, backfilled at a $6 hourly overtime premium, adds about $37,000 a year before any wage change, and that is the kind of gap a blended average buries.
Read the shifts location-first, then roll up, never the other way around.
The workforce metrics that explain a labor cost shift
Labor cost as a share of revenue is the number finance already watches, and limited-service restaurants ran 31.7% of sales in 2024, three to four points above their historical norm, per the National Restaurant Association.
The ledger records the changed ratio; these site-level hiring metrics explain what moved it.
- Turnover cost: Exits times fully-loaded replacement cost, computed by site, so the site number shows where the money leaks and the company number only confirms the aggregate.
- Cost-per-hire: Track the true loaded number over time using the full cost-to-hire formula for a frontline worker rather than agency invoices alone, and note whether you are quoting a median or an average, since the two diverge.
- Overtime ratio: Premium hours as a share of total hours is the first ratio to flag, because a site quietly running heavy overtime shows up here before it shows up in the wage line.
- Vacancy and coverage cost: What an open role costs per day, whether the site covers it with overtime or eats the lost output.
- Time-to-hire by location: This one can move before turnover cost and overtime, so longer fill times work as an early warning of premium-hour and vacancy-cost pressure next period.
Pull these from your workforce management stack and read them at the location level, alongside the ledger view finance already has.
Connecting the analysis to workforce decisions
Segmentation and metrics only pay off when they change what the operation does next quarter. Four decisions are where that happens.
- Hiring pace: Fund the sites bleeding overtime first, not an across-the-board headcount bump that spends the same dollars where they aren’t leaking.
- Scheduling and overtime policy: Coverage designed around the demand curve beats premium backfill after the gap appears, and the overtime ratio by site shows which schedules were built for demand and which get patched weekly.
- Retention investment: Aim retention dollars where turnover cost concentrates, focused on the voluntary exits operational changes can prevent.
- Location and staffing-mix strategy: Change the mix at the sites the segmentation flagged, where the variable is local market conditions or site management, not the standard playbook.
Every one of these starts from the location P&L, not the company average.
How Fountain gives finance the workforce data behind the labor-cost line
The general ledger shows labor cost after payroll closes. The turnover events, requisition ages, coverage gaps, and onboarding status behind that number live in the hiring and scheduling tools, and for high-volume frontline employers those tools are Fountain.
Cue, the orchestration layer and single entry point to Fountain’s agents, takes a plain-language request without a report build: an operations lead can ask, “Show me the locations running the most overtime this month and how long each open role has been vacant,” and get the sites and requisition ages back.
The agents Cue coordinates map to the drivers this article has tracked:
- Anna runs voice screening around the clock and scores candidates as they apply, so a Saturday-night applicant is screened before Monday, shrinking the time-to-hire drag that feeds overtime.
- Emma answers candidate questions over voice and SMS and moves onboarding paperwork, so new hires reach productive work sooner.
- Sam runs post-hire check-ins that surface early quit risk, the signal that precedes replacement cost. Finance still owns the budget, and managers approve every offer and exception.
Underneath, Shift & Scheduling is where coverage cost is most actionable, because it flags gaps while the schedule is still editable and applies overtime limits during scheduling rather than after payroll closes.
The ATS, CRM, and Sourcing layers carry the hiring and vacancy data that feeds the same view. Fountain feeds this into the model finance already runs and integrates with payroll and HCM systems, including UKG, ADP, SAP, and Workday, leaving them as the systems of record.
The payoff lands in the hiring line. For example, using Fountain, Alto achieved a $300 average cost-per-hire (against SHRM’s roughly $4,700 benchmark), a 2-to-7-day time to offer, and 450 drivers hired in six months with three recruiters.
The labor-cost line moves most when workforce decisions move, and those decisions happen at the site level weeks before they reach the ledger. Reading the shift by driver and by location turns the workforce half of the line from a postmortem into a forecast input.
Book a demo to see coverage cost by location before it reaches payroll, walk Cue’s plain-language views, Shift & Scheduling’s gap alerts, and the segmented metrics this article recommends.
Frequently asked questions about labor cost shifts
What causes labor costs to shift?
Two kinds of causes. Wage growth, benefit inflation, and minimum-wage changes raise the price of every hour on a schedule you plan around. Turnover, overtime, open roles, staffing mix, and new-hire ramp change how many hours the operation consumes and how many carry a premium, and in hourly-heavy businesses that second category drives most of the variance against plan.
What is the difference between market-driven and workforce-driven cost shifts?
Market-driven shifts, such as annual merit increases and benefit renewals, arrive on a known schedule and apply broadly, so finance plans around them. Workforce-driven shifts come from hiring, scheduling, and retention outcomes, which means operational decisions can reduce them rather than just absorb them.
How do you analyze labor costs by location?
Measure labor cost per site against the network, alongside site-level turnover, overtime ratio, and time-to-hire. Company-wide averages can conceal the handful of locations driving the miss, so inspect site performance before trusting a blended figure.